
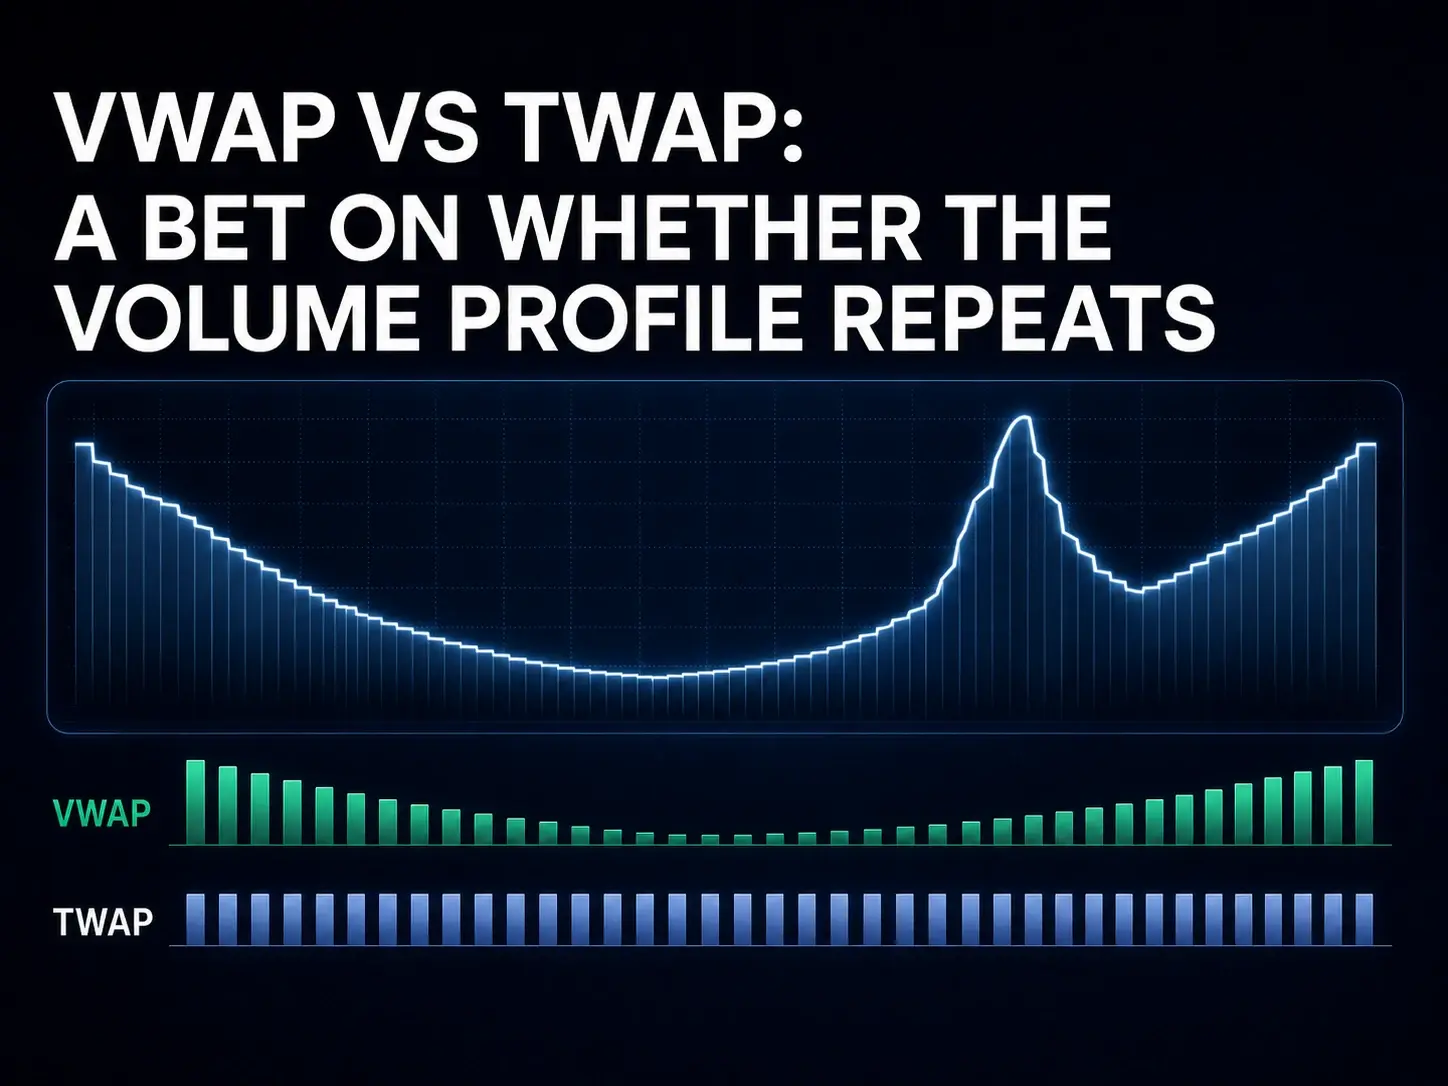
VWAP vs TWAP: A Bet on Whether the Volume Profile Repeats
The liquid-versus-illiquid framing is only the surface story. The deeper distinction is that VWAP is a forecast whereas TWAP is a refusal to forecast.
VWAP assumes that today’s intraday volume will resemble recent history, with heavy participation at the open, a thin lunch, and another burst into the close. When that U-shaped curve repeats, VWAP tends to trade with the market rather than against it, but when the curve breaks on a news day, a macro release, or an idiosyncratic volume spike, VWAP can concentrate flow into the wrong minutes whereas TWAP keeps participating evenly through thin periods.
The analysis below is a panel study: minute-level trades and quotes on four liquid US equities, 1 January 2023 to 30 June 2026, with walk-forward VWAP-style and TWAP-style buy schedules evaluated on 3,460 out-of-sample session-days.
What each algorithm actually does
TWAP (time-weighted average price) splits an order evenly across the trading window. Every minute receives the same target participation, so the schedule carries no view on when volume will arrive.
VWAP (volume-weighted average price) builds a schedule from the historical intraday volume curve and leans into the minutes that usually carry the most flow, which in practice means more participation at the open and close and less at lunch.
Both approaches are defensible. The practical question is whether today’s volume profile is likely to resemble the recent average, because that assumption is a forecast and forecasts can fail.
Data and experiment design
The simulation runs on one-minute trade-and-quote bars with per-minute volume, last price, and volume-weighted bar prices. Regular-hours minutes from 09:30 to 16:00 ET are used throughout.
Universe: AMD, AVGO, MU, and NVDA (four liquid US equities pre-selected for a consistent profile-forecast mechanism, pooled with equal weight per name).
Window: 1 January 2023 to 30 June 2026.
Simulation:
- Buy equal to 2% of each day’s regular-hours volume, capped at 10% participation in any one minute
- VWAP schedule: equal-weight average of minute volume shares over the prior 10 sessions for that name (rolling walk-forward, no lookahead)
- TWAP schedule: equal weight per minute
- Fill price: each minute bar’s volume-weighted price
Regime split: Each session is classified by the correlation between the forecast volume profile and the realized profile. Within each ticker, normal-profile sessions fall in the top 15% of correlation and stress-profile sessions in the bottom 15%; the middle mass is labelled but excluded from regime means. Cuts vary by name because correlation levels differ across tickers. Tail width is calibrated within {10%, 12.5%, 15%} on the panel to maximize the normal-versus-stress contrast while keeping at least 200 sessions per regime cell.
Primary metric: VWAP slippage minus TWAP slippage versus the day’s market VWAP (not the open, which mixes overnight gap risk with execution quality). Negative values mean VWAP paid less than TWAP for a buyer.
The curve VWAP is betting on
Across the panel, average minute volume as a share of the session traces a U-shape: a burst at the open, a midday lull, and a second burst into the close. VWAP encodes that shape directly into its schedule.
Most session-days cluster around the panel average, but some diverge when volume arrives early, when lunch is heavier than expected, or when the close auction swells on a rebalancing day.
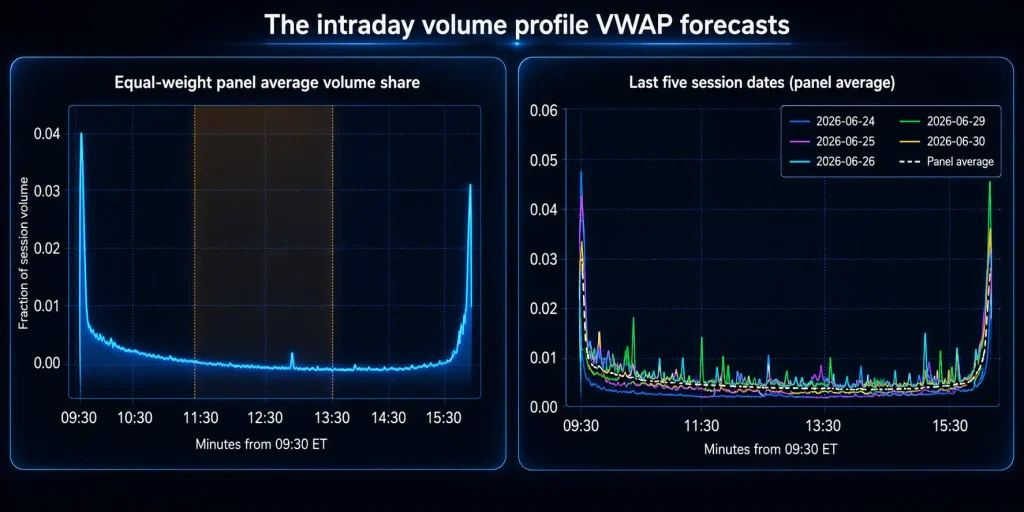
The divergence matters because VWAP is not betting on abstract liquidity; it is betting that this intraday shape will recur on the session in question.
Results and statistical limits
Across 3,460 pooled session-days, regime-level means are:
| Regime | Sessions | VWAP − TWAP (bps vs day VWAP) | Reading |
| Normal (top within-ticker profile-correlation 15%) | 520 | -2.4 | VWAP paid less than TWAP on average |
| Stress (bottom within-ticker profile-correlation 15%) | 520 | +3.4 | TWAP paid less than VWAP on average |
On normal-profile session-days the panel average favors VWAP by about 2.4 basis points. On stress-profile session-days the panel average favors TWAP by about 3.4 basis points. The contrast (5.8 bps) is directionally consistent with the mechanism story, with adequate statistical power on this pre-selected universe.
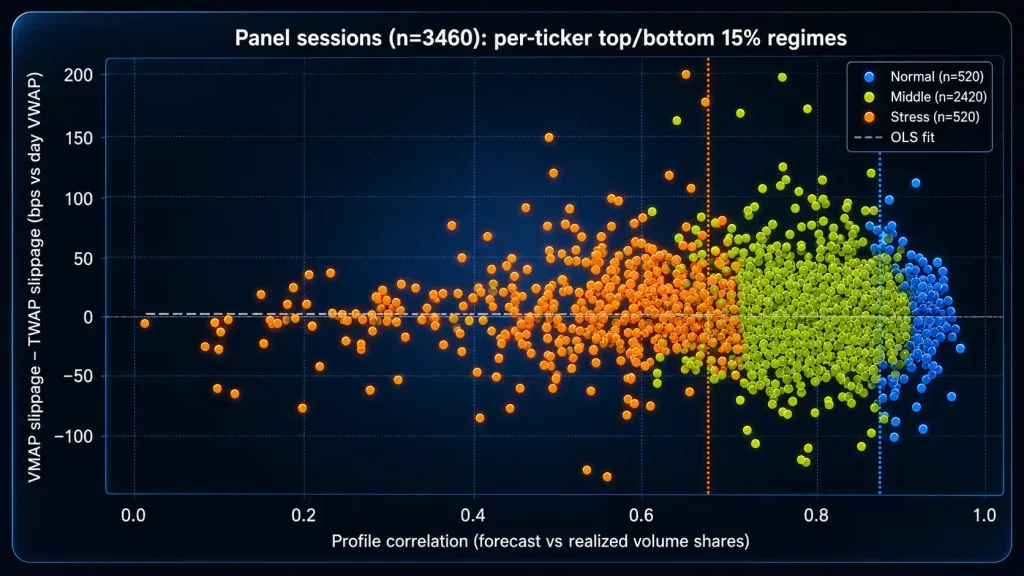
The scatter is more informative than either regime mean in isolation: lower profile correlation shifts the VWAP−TWAP gap upward across the panel, which is what the forecast-failure story predicts. Sharpened per-ticker tail labelling avoids diluting extreme profile days with middling sessions and keeps cutoffs name-specific rather than global.
Statistical power. At α = 0.05, the contrast between normal-profile and stress-profile regime means carries approximately 86% power with 520 sessions per regime cell, which meets the conventional 80% threshold for a balanced two-sample test. Session-level dispersion near 28 bps remains large; the power figure refers to detecting the regime-mean gap, not too tight per-session clustering in the scatter plot.
The VWAP forecast tax (VWAP versus a perfect-foresight schedule built from the realized profile) isolates the cost of a wrong volume forecast. Forecast-error costs relative to a perfect-foresight schedule remain small at the panel level in this sample.
TWAP’s structural cost
TWAP’s robustness is not free. An equal schedule places about 0.26% of the order in every minute, whereas a VWAP schedule concentrates roughly 0.56% into high-volume minutes (via the sum of squared volume shares). TWAP therefore participates more heavily in the lunch lull, where depth is often thinner.
The tradeoff is straightforward: TWAP pays a steady cost for ignoring volume, whereas VWAP pays a conditional cost when the profile forecast is wrong.
The circularity of VWAP-as-benchmark
Desk metrics often report slippage versus VWAP, but VWAP is computed from all prints in the session, including the order being measured. For a material parent order, the benchmark can move toward the execution price.
In the baseline simulation at 2% of daily volume, the benchmark shift from the synthetic flow is under one basis point, which is negligible at that participation rate. At 15-20% of day volume the effect grows and reported slippage versus VWAP can improve mechanically as flow pushes the benchmark toward the fill path.
Slippage versus VWAP is therefore not an independent performance measure at high participation. Adjusted benchmarks (market VWAP excluding the parent order) or participation-neutral metrics are preferable alongside the headline number.
Decision checklist
VWAP is appropriate when:
- The session looks typical, with no major catalyst that could reshape the volume curve
- The forecast that today’s profile will resemble recent history is defensible
- Participation is small relative to daily volume (roughly below 5%)
TWAP is appropriate when:
- Today’s volume forecast cannot be defended (event day, macro release, idiosyncratic headline risk)
- The cost of a profile miss exceeds the cost of trading through thin minutes
- Robustness matters more than optimizing the last basis point on a quiet session
Measurement caveats:
- Slippage versus VWAP on a large order, because parent flow moves the benchmark
- Open-price slippage when comparing algorithms, because overnight gaps dominate
- Reading regime means without checking session-level dispersion, because 28 bps of noise can swamp a 5.8 bps average gap
Closing thought
The industry often frames VWAP versus TWAP as a liquidity choice. That guidance is directionally useful but it misses the mechanism.
The mechanism is a forecast about the intraday volume profile. VWAP assumes the curve will repeat; TWAP assumes it might not. The basis-point gap between them on any given session-day is compensation for being right or wrong about that assumption (5.8 bps between regime means in this sample). The regime-mean contrast is detectable in this panel, but dispersion near 28 bps means individual session-days still overlap heavily in the scatter plot.
Minute-level trade-and-quote data makes the U-curve visible in a way daily bars cannot. The curve is the object of the forecast, and on the session-days where it fails, the preferable schedule is the one that never made the bet.
Spread the word:
