
Execution Risk in Quant Trading Kills More Strategies Than Bad Backtests
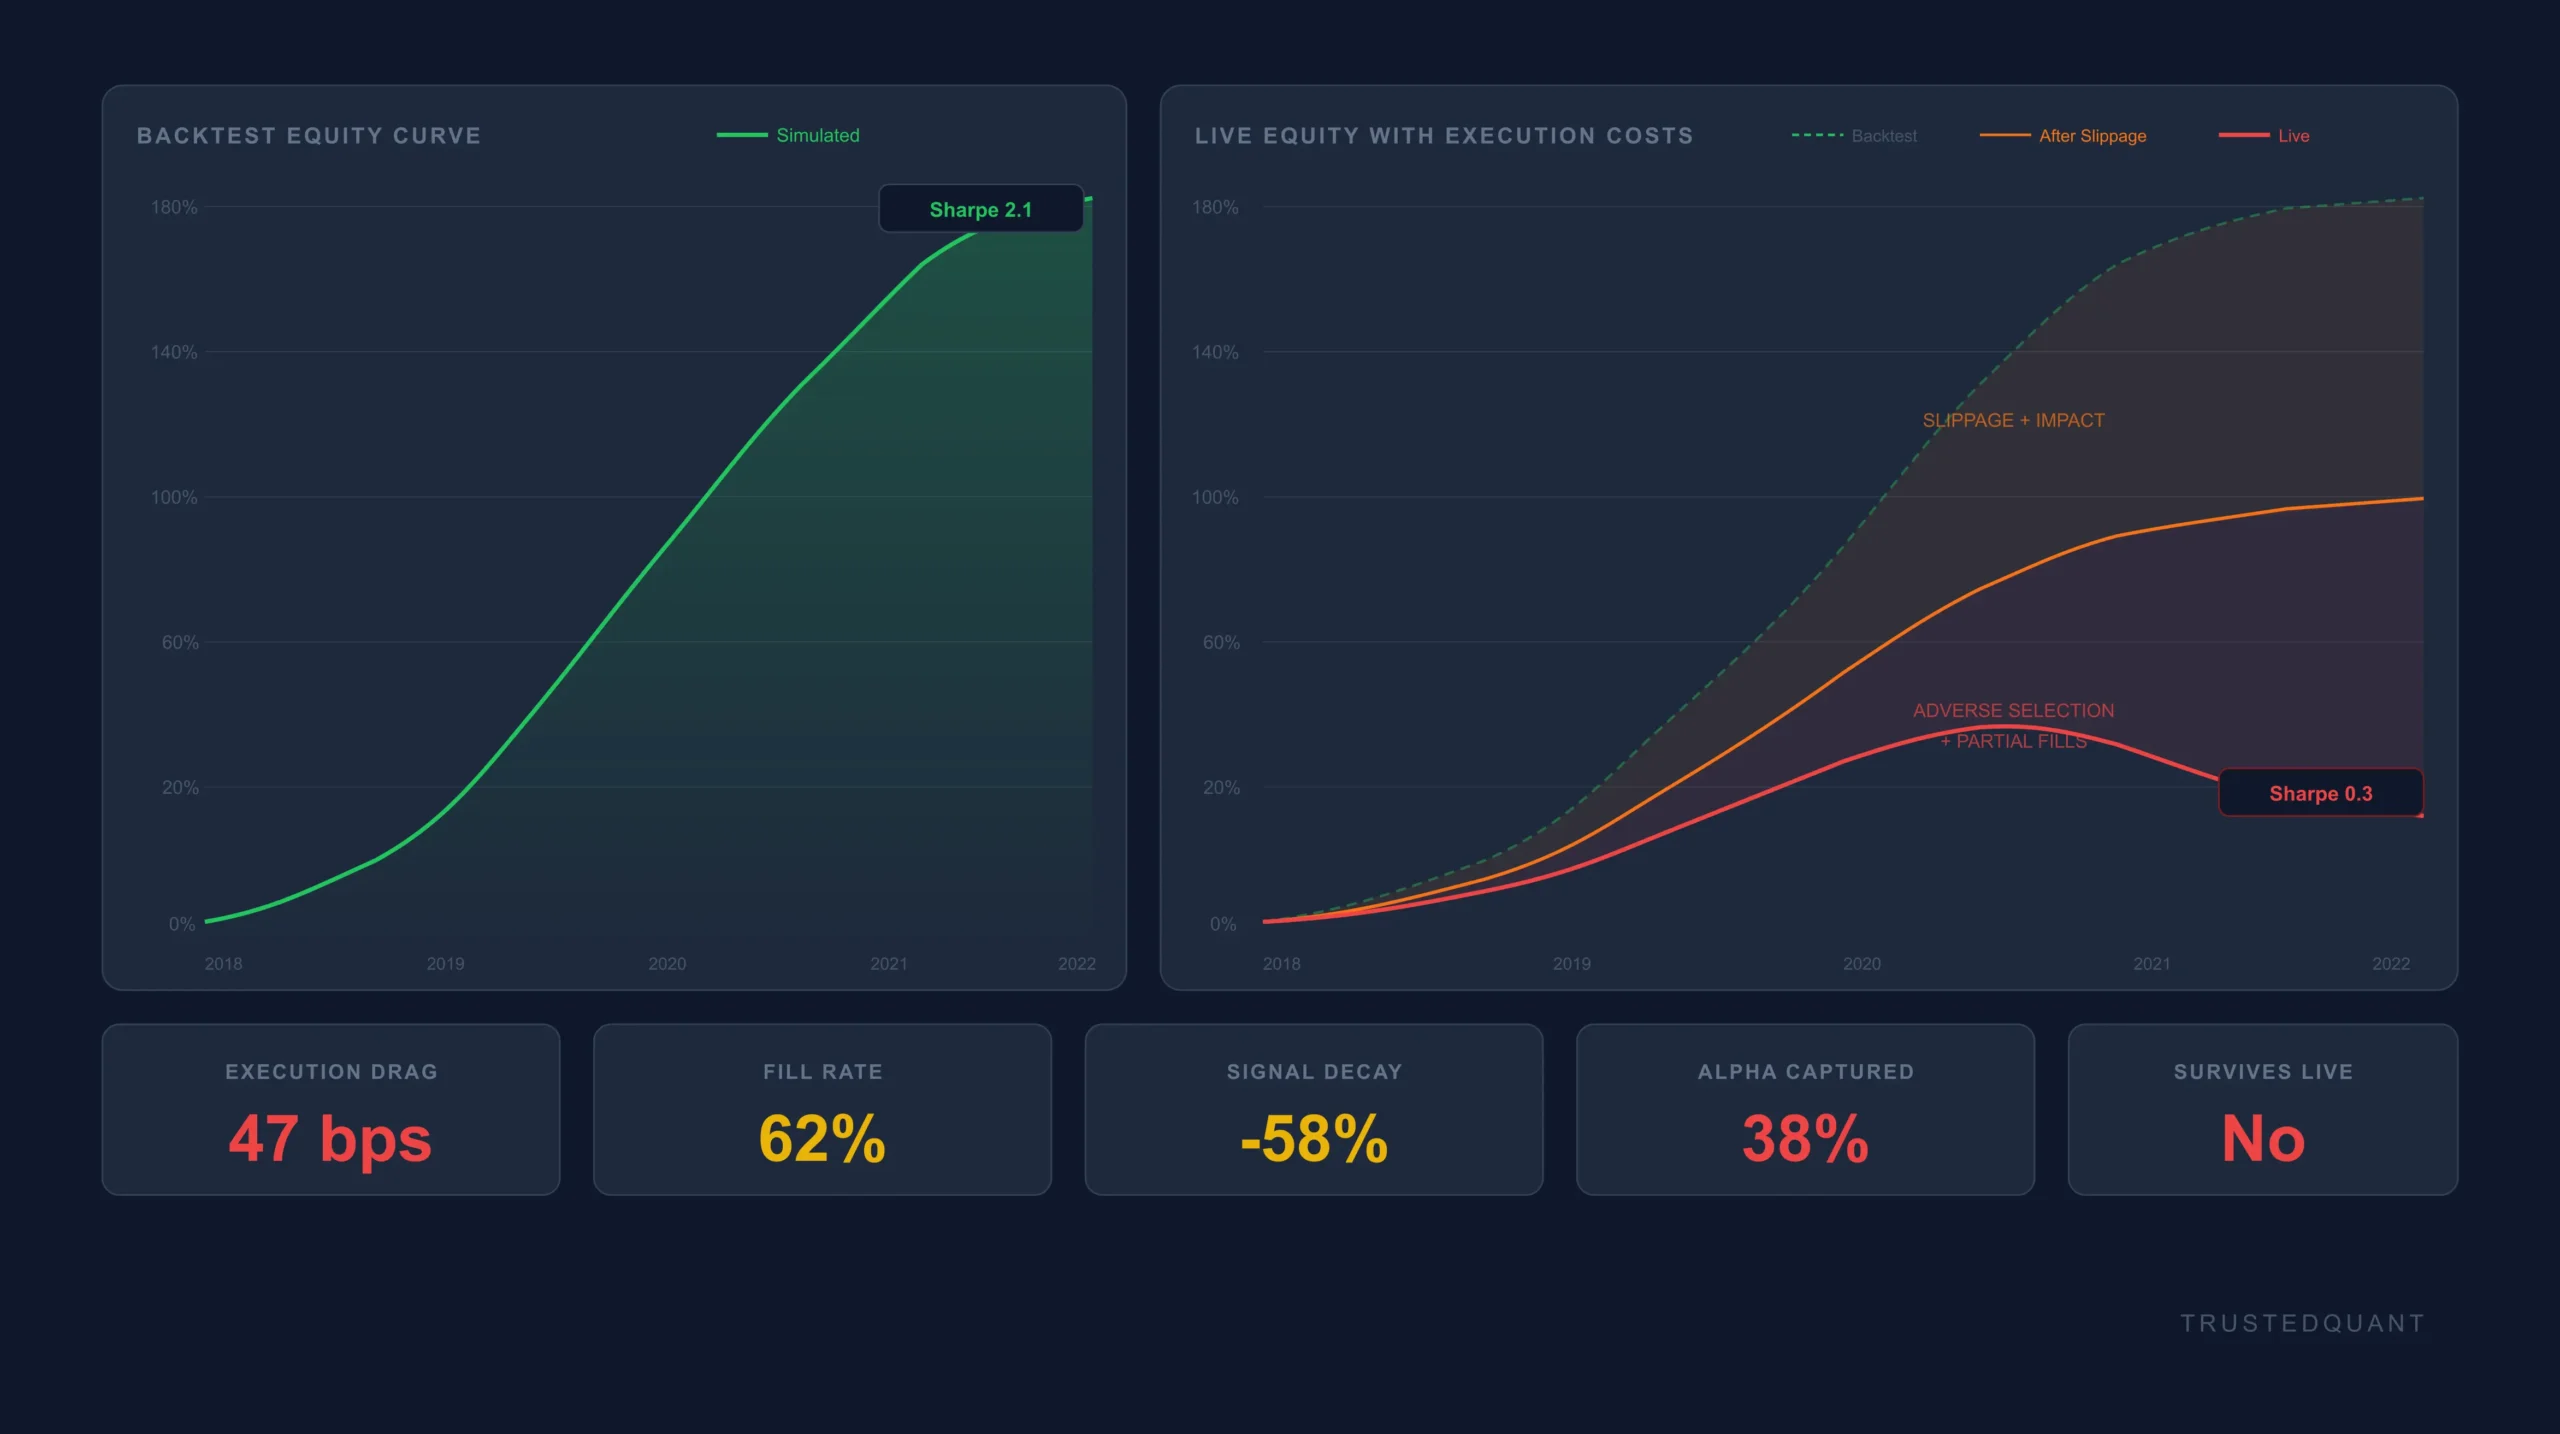
Most postmortems on failed quantitative strategies start with the signal. Was the alpha overfit? Did a regime shift invalidate the thesis? Was there lookahead bias hiding in the backtest? These are reasonable questions, and sometimes the answer is yes, but more often the signal was doing exactly what it was supposed to do and the strategy bled out somewhere between the signal firing and the fill arriving. That gap, the interval between your model saying “trade” and the exchange confirming your position exists, is where slippage, market impact, queue position, partial fills, adverse selection, and signal decay all live, and backtests compress every one of those mechanisms to zero.
This page anchors TrustedQuant’s work on execution failure modes. The articles linked below cover specific mechanisms in depth, and what follows here is the architecture of the problem: how execution costs interact, why they compound, and why modeling them after the fact rarely captures what actually went wrong.
What Backtests Assume About Execution
Every backtest framework encodes a theory of how orders become positions, and most of them encode one that has little to do with how exchanges actually work. A signal fires, a position appears at the market price or something close to it, the position is always the intended size, the fill always happens at the decision timestamp, and the market does not react to the order. These assumptions run so deep in standard frameworks that many researchers never interrogate them, which means the gap between simulation and production is invisible until capital is at risk.
How much that gap costs depends on the strategy. A portfolio rebalancing monthly across liquid large-caps can absorb imprecise execution because the holding period is long enough and the alpha diffuse enough that a few basis points of slippage wash out. A mean reversion strategy trading technical levels in midcap names cannot absorb it, because the entire edge lives in precisely the price region where fill quality determines whether the trade works. Same framework, same default assumptions, and radically different sensitivity to how faithfully the simulation represents what actually happens on the exchange.
The common response is a constant slippage parameter: ten basis points per side, applied uniformly across every trade, every name, every market condition. In production, slippage clusters in ways a constant parameter cannot capture. It spikes at the open, around earnings, during index rebalances, and whenever your signal correlates with the signals of other systematic funds executing on the same schedule, which means the parameter averages over exactly the variation that determines whether the strategy survives.
Where Execution Costs Come From
Spread is the one component you can measure before committing capital, and because it is visible, it tends to absorb most of the attention in backtest cost modeling while the larger costs go unmodeled.
Market impact follows a rough square-root law relative to order size and available liquidity, which means doubling your order increases impact by around forty percent rather than one hundred. By the time you are working the fifth tranche of a position, the price has moved enough that remaining shares fill at levels your model never contemplated, and strategies that backtest well at theoretical position sizes often fail at executable ones because scaling down to sizes that production liquidity can support sometimes leaves alpha that no longer clears costs.
That same disconnect between simulated and actual prices shows up in timing slippage, though through a different mechanism. A daily strategy that generates signals at the close and trades at the next open loses part of the expected return to overnight gaps, and momentum strategies suffer disproportionately because their strongest signals tend to gap in the direction of the signal before the open, as the information the model detected was also detected by others. The backtest prices the entry at the close while production prices it at whatever the open delivers, and the difference eats into the return that justified the trade.
Limit orders create a third category of cost through adverse selection. When a limit buy fills, it fills because sellers drove the price down to your level, and frequently they continue driving it lower. Backtests that check whether price touched a limit level and mark it as filled systematically overstate performance, because in production, queue position, order size, and the velocity of price movement all determine whether a touch becomes a fill, and the fills you do receive are biased toward the cases where the market kept moving against you.
Fills, Queues, and the Alpha That Leaks Out
The mechanisms described above operate at the level of price and size, but a second layer of execution risk lives in the microstructure of how orders interact with the matching engine, and this layer is harder to observe in historical data.
An order placed at a popular technical level joins a queue behind every other order that arrived earlier, and if the level holds, buying pressure fills orders from the front while orders near the back never execute because the pressure exhausts itself before reaching them. Trade and quote data alone cannot tell you where a hypothetical order would have sat in that queue, so the backtest treats any price touch as a fill, and for strategies built around limit entries at specific levels, this overestimate can account for a meaningful share of the apparent edge.
Partial fills introduce a different problem that accumulates rather than striking on any single trade. Your model targets five thousand shares and production fills twenty-three hundred before the price moves away, leaving you with a position that tracks poorly against the intended portfolio. Chasing the remaining shares at worse prices costs additional alpha, while holding an undersized stub generates tracking error that compounds across the portfolio. High-turnover strategies accumulate these residuals across hundreds of trades per month, and the cumulative drag exceeds what most teams expect before going live.
These mechanisms reinforce each other in practice. A strategy relying on limit orders at technical levels in midcap names faces queue position risk, adverse selection, and partial fill risk simultaneously, and while each alone might cost five to ten basis points, the interaction between them can consume half the backtest’s apparent edge because the conditions that cause one also cause the others.
How Data Quality Contaminates Execution Models
All of the execution costs described so far assume that the prices in your backtest at least reflect the prices available in real time, and for many data sources this assumption is wrong in ways that compound with the execution modeling errors.
Consolidated tape data introduces latency relative to direct exchange feeds, and during fast price movement the price your backtest records at a given timestamp may differ from the price available on the exchange by several ticks. At daily frequencies this discrepancy is invisible, but at intraday frequencies, particularly anything below five-minute bars, it biases the backtest toward fills that production could not have delivered.
Timestamp resolution creates an adjacent distortion. Trade data recorded at one-second granularity cannot distinguish a fill at the beginning of a second from one at the end, and a strategy that assumes execution at the recorded timestamp is implicitly averaging across an interval where the price may have moved several basis points. This becomes material for anything operating at sub-minute horizons, where the averaging effect is large relative to the edge the strategy is trying to capture.
Corporate action adjustments introduce a subtler contamination that operates on a different timescale. When a data vendor retroactively adjusts prices for splits, dividends, or spinoffs, the adjusted price at the historical timestamp embeds information that was not available at that time, which means your backtest buys at a price shaped by future knowledge of the adjustment. The distortion from any single event is small, but it compounds across thousands of corporate actions over a decade of data, and the magnitude varies by vendor, by asset class, and by how aggressively the vendor adjusts.
What Paper Trading Catches and What It Misses
Paper trading appears to close the gap between simulation and production by submitting real orders to real exchanges without committing capital, and the mechanical failures do surface: timing drift, state management bugs, connectivity problems, differences between how your order management system performs in test and in production. These are genuine problems, and paper trading is the right tool for finding them.
What remains hidden is market impact. Without capital at risk, your orders do not move the price, so the fills you observe reflect a market that did not react to your presence. For small positions in liquid names the difference between paper fills and live fills may be negligible, but for anything with meaningful market impact, the paper trading period establishes a floor for execution quality that live trading will break through. The distinction matters because teams that treat paper trading as an execution quality benchmark rather than a mechanical validation tool carry false confidence into production, where the actual cost structure is worse than anything the paper period revealed.
Why Execution Costs Compound Instead of Adding Up
A strategy losing ten basis points to slippage, five to adverse selection, and five to partial fills does not lose twenty basis points in aggregate, because the mechanisms feed into each other. Adverse selection is worst on the trades where slippage is highest, since both respond to the same underlying condition, and partial fills cluster in the trades with the largest impact because those are the trades where liquidity was thinnest. Modeling each cost independently and summing them underestimates total execution drag, sometimes by a factor of two, because the correlation between the costs is where the compounding lives.
Strategies that barely clear costs in a backtest almost never survive production for this reason: the simulation underestimates each component and misses the correlations between them entirely. Surviving requires enough gross alpha to absorb not just expected execution costs but the tail of the cost distribution, and the strategies that manage this tend to share a few characteristics. Their signals decay slowly enough relative to execution latency that the alpha is still there when the fill arrives, their instruments are liquid enough that impact stays contained, and their position sizing is conservative enough that partial fills do not create meaningful tracking error. Fewer strategies satisfy all three conditions than backtests suggest.
Further Reading
- Your Alpha Decays the Moment You Trade: How price impact, information leakage, and adverse selection consume your alpha the moment you start trading.
- Your Transaction Costs Are Higher Than Your Model Says: A broader treatment of how transaction costs accumulate and what they cost systematic strategies.
This content is for educational purposes only.
Spread the word:
