
Risk-Adjusted Metrics Beyond the Sharpe Ratio
Show a quant a Sharpe ratio and the reflex is to reach for a better one, swapping in Sortino because Sharpe treats a windfall and a blowup as the same variance, then Calmar when the concern is the depth of the hole, then Omega for the whole shape of the distribution in one number. The instinct feels like rigor, since each alternative fixes a named defect in Sharpe and reporting three of them instead of one, reads as diligence.
The instinct is mostly wasted, and where it is not, it tends to run backwards. Eling and Schuhmacher put twelve alternative performance measures against Sharpe across 2,763 hedge funds and found the rankings almost identical, with Spearman correlations above 0.99 for most of the field, meaning the measures built to disagree, agreed. That result is a decade old and gets cited as a curiosity, so what follows runs the same test at scale and across markets, on strategies that are controlled end to end rather than on reported fund returns.
Agreement, measured across three asset classes
One engine builds the corpus so the comparison turns on the market rather than the generator: the same technical families, moving-average and EMA crossovers, Donchian breakouts, RSI, Bollinger bands and MACD, each crossed with parameter grids and a long-or-short switch, run over every instrument’s full 2020 to 2026 daily history. The universe spans 120 US stocks and 18 futures plus 27 crypto perpetuals, giving 30,685 costed strategies split across the three classes. Every fill is charged to its venue, roughly two basis points a side plus borrow for equities, a tick for futures, five basis points of taker fee and three of slippage with funding on the held leg for crypto.
def sharpe(x):  return ANN * x.mean() / x.std()
def sortino(x): return ANN * x.mean() / np.sqrt((np.minimum(x, 0)**2).mean())
def omega(x):   return x[x > 0].sum() / -x[x < 0].sum()
def calmar(x): eq = x.cumsum(); return x.mean()*BARS_YR / (np.maximum.accumulate(eq) - eq).max()Rank every strategy by Sharpe and rank it again by each alternative, then correlate the two orderings, whereupon the full-pool agreement is near-total in every market: Sharpe against Sortino comes to 0.999 in equities, 1.000 in futures and 0.997 in crypto, with Omega and Calmar close behind in the high 0.98s. Eling and Schuhmacher’s finding reproduces on three asset classes at once, a decade and an ocean away from the hedge-fund panel that produced it. For the general case the conclusion is blunt, in that a Sharpe ratio already in hand makes the Sortino ratio almost redundant, because the two place the strategies in the same order.
That is the part people quote and then ignore, because the behavior worth looking at is not in the aggregate but in the tenth of the pool that would actually be funded.
The divergence hides where you choose
Nobody allocates to the median strategy, so the eye goes to the top of the Sharpe distribution, where the agreement that held across the full pool starts to come apart (Figure 1). Restrict to the top Sharpe decile within each class and the alternatives peel away by amounts that depend on both the metric and the market: Sortino still tracks Sharpe at 0.97 in equities and 0.98 in futures yet only 0.62 in crypto, Omega sits between 0.50 and 0.78, and the K-Ratio, taken up below, falls to 0.38, 0.61 and 0.22. The metrics agree about which strategies are mediocre while they disagree about which are best, so selection lives entirely in the second question.
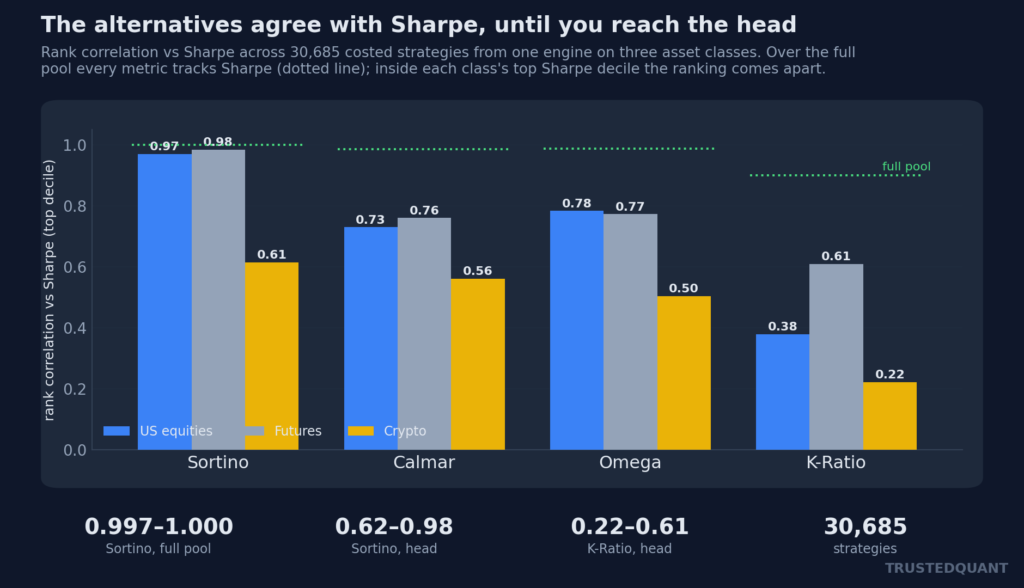
Figure 1: Rank correlation against Sharpe across 30,685 strategies from one engine on three asset classes. Over the full pool every metric tracks Sharpe (the dotted line near 0.99); inside each class’s top Sharpe decile the ranking comes apart, and the market with the fattest tails, crypto, comes apart first.
The divergence is not spread evenly, since across the full pool the trade-return distributions stay close enough to symmetric that every metric reduces to a rescaling of Sharpe, whereas the top decile is where the pathological shapes concentrate: the negatively skewed premium-collectors, the fat-tailed breakout books, the strategies with a track record too short to have met their bad day. Those are exactly the shapes the alternatives were built to reweight, so the head is where they finally break with Sharpe, and a break means one of them flatters the strategy more than the others.
Metric-shopping is selection bias
Here is the trap the agreement result sets up, in that quoting Sortino instead of Sharpe looks free while the measures are interchangeable, a stylistic choice with no consequence, right up until the strategy in question is one of the negatively skewed fat-tailed ones where they spread out. On exactly those strategies a menu appears, whereby anyone with a position to justify can read down it and report the number sitting at the top.
That is a selection decision applied to the evaluation step, the same move as overfitting a backtest but aimed one level up, given that overfitting a strategy means searching configurations until the equity curve looks good whereas metric-shopping means fixing the strategy and searching measures until the scorecard looks good. Both mine a metric by choosing the search axis that maximizes it after the fact, thereby inheriting the same statistical inflation. Consequently, a backtest that reports the best of a dozen measures without disclosing the broader search is simply quoting a maximum and calling it an estimate.
The tell is mechanical, in that a strategy whose Sharpe and Sortino ranks agree was never affected by the choice of measure, whereas one whose ranks disagree sits in the pathological tail where the disagreement itself is the reason to look harder rather than pick the higher one. The disagreement is the signal, a flag that the distribution is doing something a single ratio cannot summarize rather than a license to shop.
Sharpe cannot see the order of returns
There is a second blind spot that none of Sortino, Omega or their kin repair, since they all share it: Sharpe is a function of the set of returns rather than their sequence, so mean and standard deviation cannot know which month came first. A strategy that made all of its money in one lucky clustered stretch and drifted the rest of the time scores identically to one that ground the same returns out steadily, because the two hold the same returns in a different order.
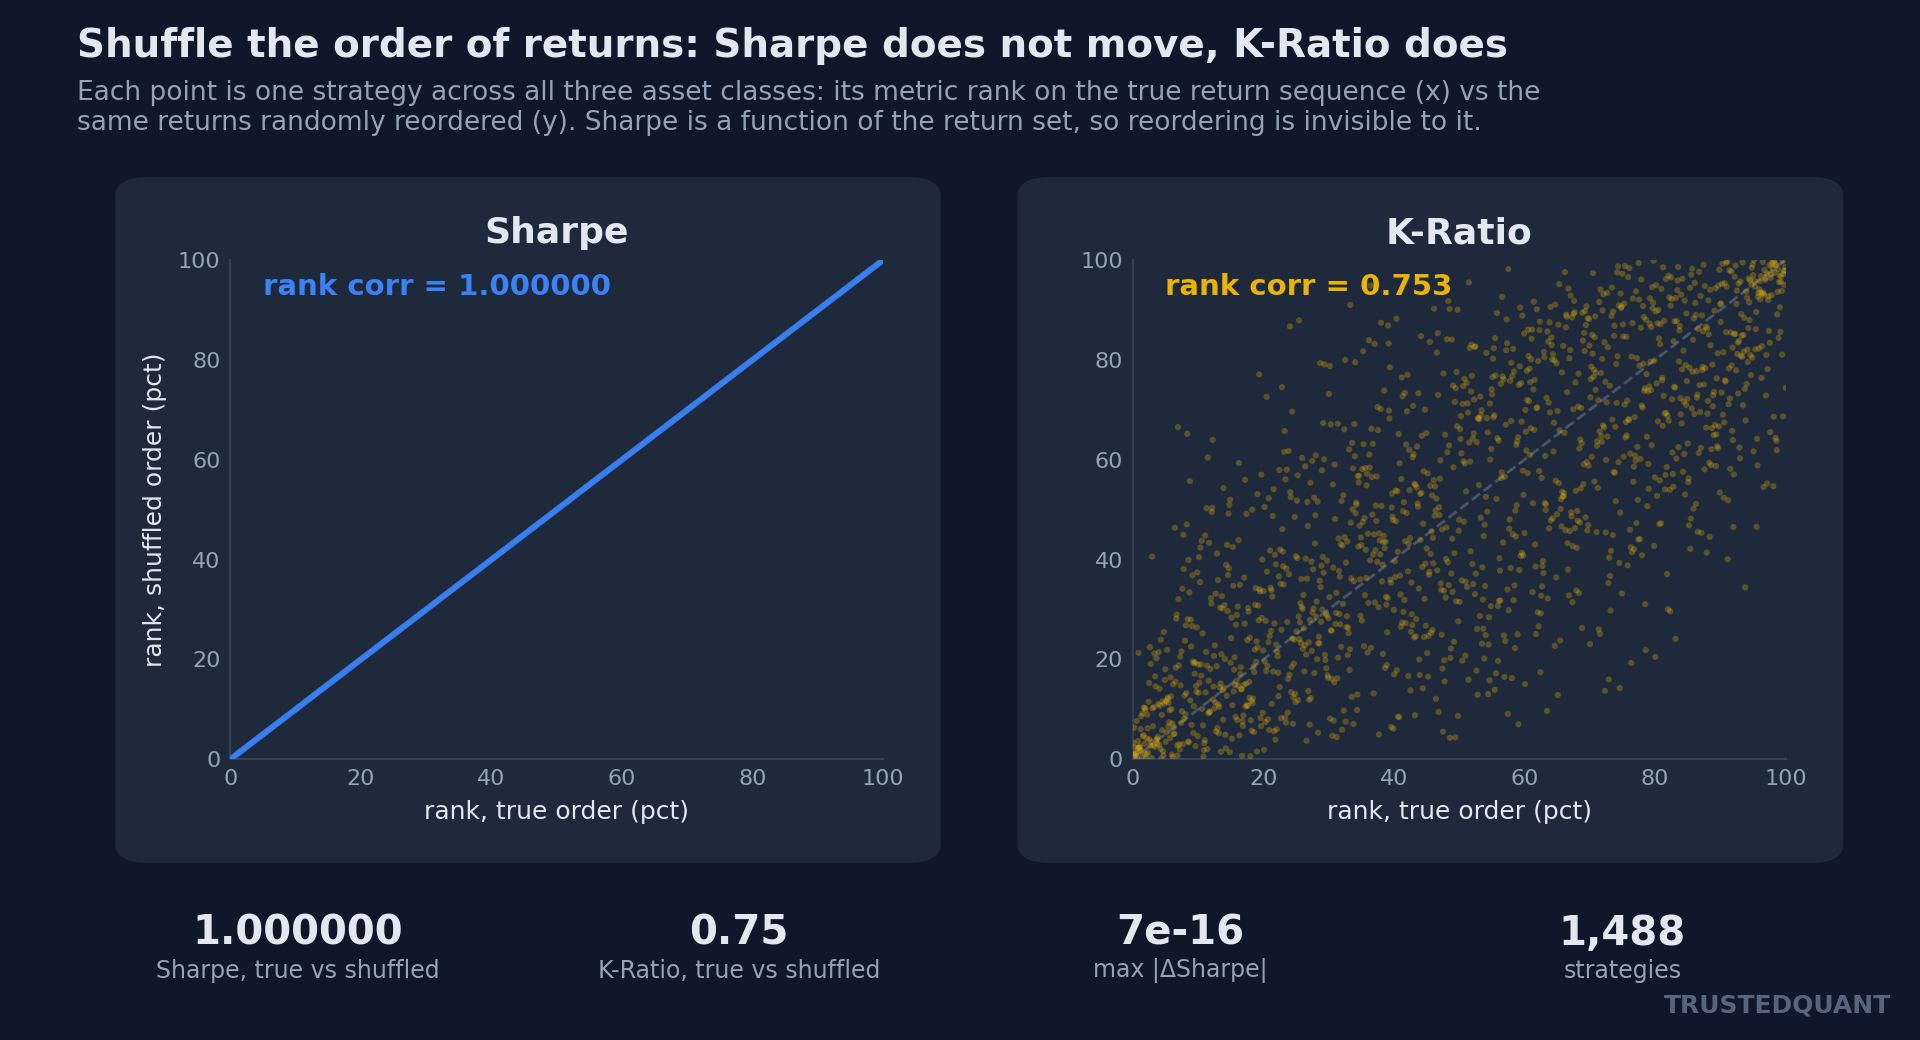
The point holds on the data rather than in the abstract, since shuffling each strategy’s return stream into a random order and recomputing leaves the Sharpe ratio unmoved across the whole cross-asset sample, with the largest absolute change landing at 7e-16 of floating-point noise and the rank correlation between true-order and shuffled-order Sharpe at 1.000000. Sortino and Omega are permutation-invariant by the same argument, leaving reordering invisible to all of them (Figure 2, left).
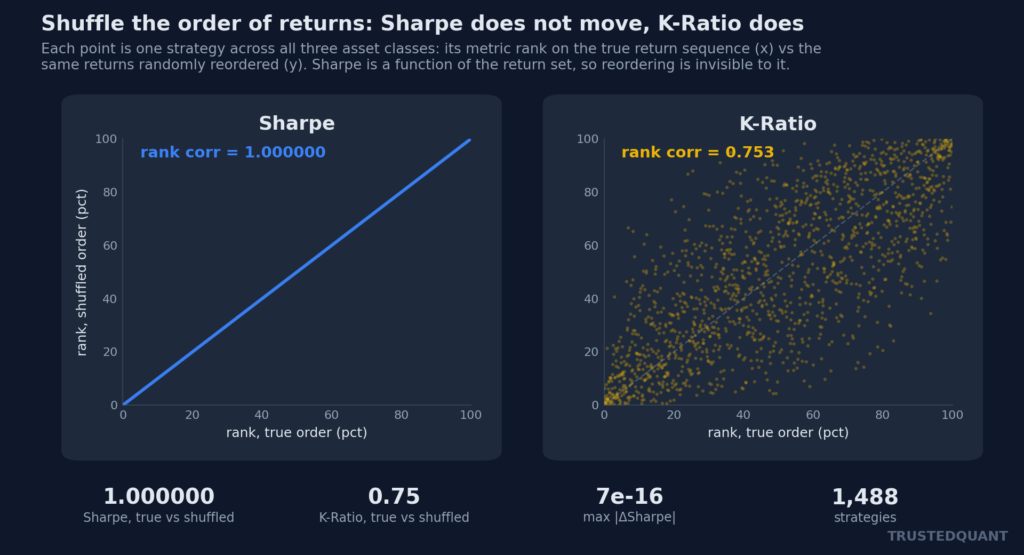
Figure 2: The same strategies scored on their true return sequence versus a random reordering of it, pooled across all three classes. Sharpe is unchanged to floating-point precision, while the K-Ratio, which scores the straightness of the cumulative equity path, scatters to a rank correlation of 0.75.
Kestner’s K-Ratio is the one measure that does read order, since it regresses cumulative equity on time and reports the slope divided by its standard error, thereby rewarding a curve that climbs in a straight line and penalizing one that reaches the same endpoint in lurches.
def kratio(x):
    eq = x.cumsum(); t = np.arange(len(eq))
    slope, _, _, _, se = linregress(t, eq)
return slope / se / np.sqrt(len(eq))Because it reads the path rather than the return set, shuffling wrecks it, so the true-order and shuffled-order K-Ratio rankings correlate at 0.75 rather than 1.0 (Figure 2, right), and the axis it measures is genuinely new information. That axis is also why it diverges hardest from Sharpe in the allocatable head, falling as low as 0.22 in crypto, since a lucky cluster and a steady climb can share a Sharpe while parting completely on how straight the equity line runs. It is the one alternative on this list that is not a reparameterization of the same underlying number.
What to actually do
Report Sharpe because everyone expects it, yet reporting Sortino or Omega as a second opinion buys little, since on the strategies that matter they mostly agree with Sharpe, and on the strategies where they do not the extra number is a temptation before it is information. The one habit worth keeping from the agreement result treats a disagreement between measures as a diagnostic rather than a menu, whereby agreement means the measure was idle while a split means a pathological distribution whose return histogram and drawdown path deserve a look rather than whichever ratio came out highest.
The K-Ratio earns a place next to Sharpe for a reason the others do not, in that it answers a question Sharpe cannot, whether the track record is a line or a lucky cluster; whereas everything else on the standard list answers the question Sharpe already answered and answers it in the same order.
This content is for educational purposes only.
Spread the word:
